This post is Part 2 of our complete Engineering Design Process Example for STEM classrooms. If you haven’t completed Part 1, start there! It covers defining the problem and developing ideas using the GRASPS model.
C – Create a Prototype

Let the fun begin! In this third step of the engineering design cycle, students create their aluminum watercraft prototype to solve the problem defined in the GRASPS. This C – Create a Prototype step is usually the favorite because students make their actual well-planned designs. The research, ideas, and creativity come together in this step!
In general, students first make a plan to build their watercraft. They then try to follow the plan and possibly modify it as they build their prototype. Finally, students document changes to their plan to conclude this step.
C.1 – Plan the Build (and Maybe the Test)
Students create a logical plan to build a prototype of their best idea to solve the problem stated in the GRASPS. Their role as the expert boatbuilder specializing in aluminum watercrafts does not change the fact that step-by-step, concise informational/explanatory writing is required.
The language of the plan could be a coherent mix of text, symbols, images, and/or sketches. Sketchnoting (i.e. visual note-taking) is a fun option that requires some practice.
Plan the Test for the Engineering Design Process Example
If you want the test data to be as accurate as possible, presenting a non-negotiable testing plan might be the way to go–or at least specify a couple of critical steps. For example, pennies should be placed carefully, one by one, in the watercraft prototype, not dropped. For virtual students, testing physical designs as a group is not possible.
If the prototype is a cooperative project and student roles for testing need to be determined, students can write a testing plan as well.
Look over parts C.1.2 and C.1.3 of the Water Tank Engineering MYP lesson for ideas about documenting the building and testing plans.
C.2 – Create and Document the Process
This is it! Here, students build their aluminum watercraft prototypes by hand, based on their best idea to meet the goal in the GRASPS. Their design usually shares characteristics of what they sketched in substep B.3 – Represent the Best Idea. How the prototype is built may match up with the building instructions in C.1 – Plan the Build as well, but not always.
Hands and Plans
For these aluminum watercraft prototypes, I would avoid using 3D objects as forms to shape the design. For example, if you have a boat model in your classroom, do not let a student wrap their five-inch square of foil around the model’s hull to create their prototype.
I feel that students should use their hands and maybe some tools (scissors, ruler). It promotes deeper thinking and encourages a greater variety of designs. You may see quite a few square boxes. That’s okay–everyone is starting with a square of aluminum foil. Just look out for flat-out copying, which in my experience is rare.
I have noticed that most students do not consult their building plan as they create their product. This tendency is probably because upper elementary-to-middle school-age students simply want to build at this point!
Everyday Materials and Reasonable Change
I prefer working with everyday materials in STEM, so the product designs I’ve done with my students wind up being not very technical. Regardless, creating a documented plan makes sense to be as prepared as possible–to support the mindset for strategic building and provide specific references to understand any changes.
I would encourage reasonable change that keeps the problem to be solved in mind. Students’ ideas develop all the time throughout the design cycle–even during the actual build. Unforeseen problems will arise at times. So plans change. Therefore, in addition to a specific building plan, photos need to be taken. This visual evidence documents accurately how the watercraft was made.
Some students prefer to video the build to document the process. Some will create screenshots of parts of the video too. I prefer to see photos because it’s a quicker way to review the actual building steps to provide any feedback.
Create sequence categories and request two to three photos per category as evidence. This chunking helps kids remember to take photos. Example categories for photo documentation of the build are:
- The Preparation [materials, resources, and group member(s)]
- The First Steps
- The Middle Steps
- The Finishing Steps
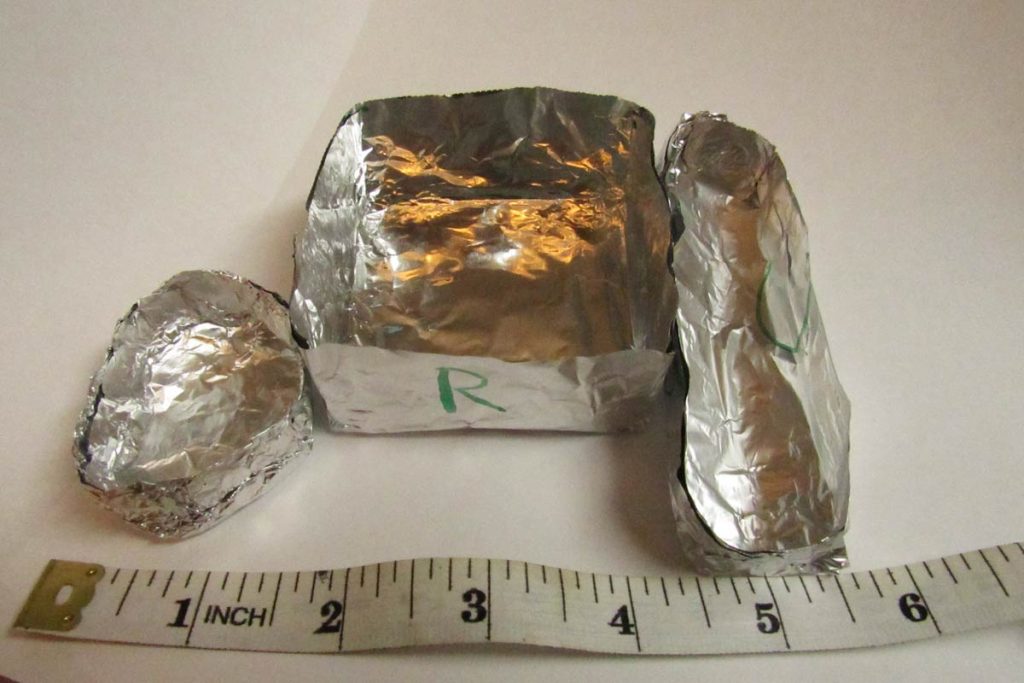
- The Final Watercraft (include a ruler for reference)
C.3 – Justify Changes to the Plan
Why should the building plan be as specific as possible? Well, for one thing, it makes documenting changes much easier. In engineering, architecture, and construction, changes to actual plans happen and are documented as change orders.
Vague, incomplete, and/or brief plans created in C.1 – Plan the Build, may limit a student’s ability to accurately identify and justify changes. Precise plans, although sometimes inaccurate, provide a clearer reference from which to identify and justify changes.
Photos Don’t Lie
An incomplete collection of photo evidence may also limit a student’s ability to accurately justify changes to a plan. In my experience, an inadequately written plan hinders detailed change justifications more than an incomplete set of building photos.
If a student declares that there were no changes to their building plan, ask them to be picky. For example, estimating the time needed per step in the plan can help students identify and justify changes.
Summary of Step C – Create a Prototype
Students have prepared sufficiently to create a well-informed design to solve the problem as described in the GRASPS for the engineering design process example. They first create a logical plan, carry it out by building their prototype, and document the execution. Students conclude this third step of the engineering design process with a description of the changes between the planning steps and the actual building steps.
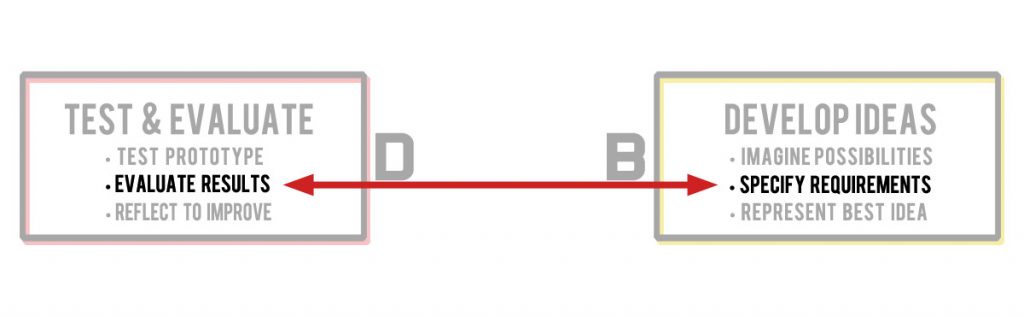
D – Test and Evaluate
At this point, the deliberate and thorough nature of the engineering design process, with teacher feedback, should have yielded many well-reasoned aluminum watercraft prototypes. Regardless, some designs may fail earlier than expected due to testing error and/or some unforeseen design flaw.
Reassure students that a failing watercraft (e.g., one that sank with fewer pennies than average) does not equate to a failing grade. A failing grade would arise from not sufficiently explaining the engineering failure. So, talk about failure and F.A.I.L. (First Attempt At Learning) with your students before you test.
At the beginning of step A – Analyze a Need was probably the last time students referenced the PBL scenario. Therefore, go over the GRASPS to refamiliarize students with their role and the goal.
Also, invite each student to hypothesize the pennies-at-failure number for their prototype. Record these estimates! One way is for students to enter these quantities in a Google Form with a short explanation—one or two sentences. Later, share with students the form’s estimates for part D.2 Evaluate the Results along with the test data gathered in D.1 – Test the Prototype.
D.1 – Test the Prototype
Try to capture as much data as possible consistently. How you go about this depends on the grade level and how precise you want to be. Control variables and record as much as you can measure. With abundant and valid data, students will have lots of opportunities to look for cause-and-effect connections.
The Physical Set Up to Test the Prototype
An easy physical test setup is a laptop next to a transparent bowl of water and about 70-100 pennies at the ready. The watercrafts should, of course, float on their own before any pennies are placed in them.
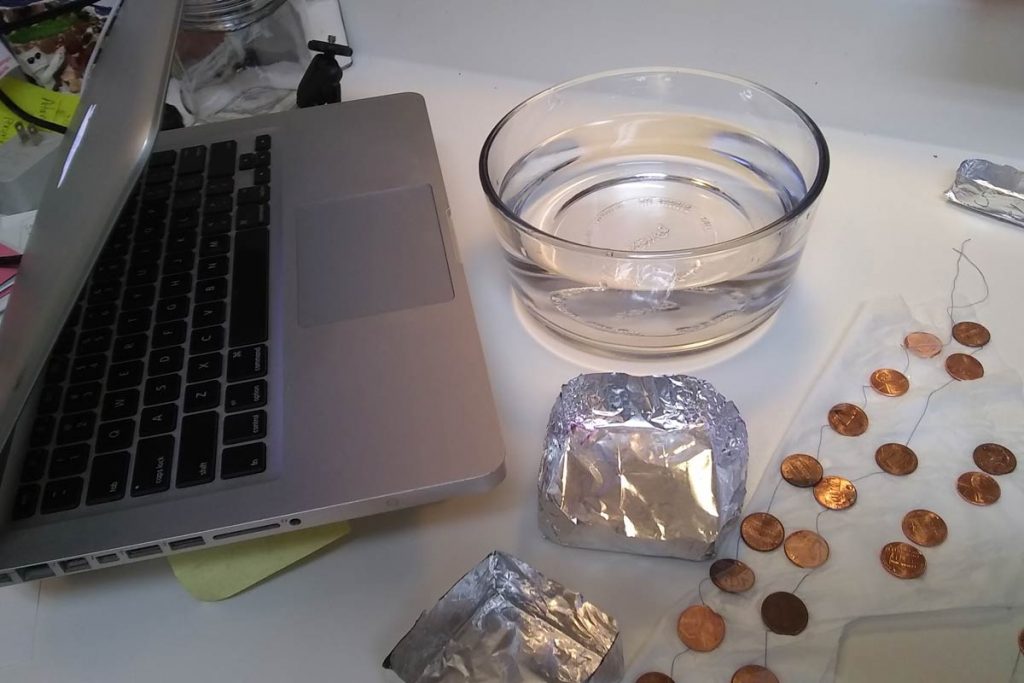
For one test, I used an older Apple MacBook Pro A1278 with PhotoBooth to record the event. I thought to tape a thread across ten pennies (I assumed a negligible additional weight of the tape and thread) to both speed up the test while ensuring gentle penny placement into the prototype.
The plastic tape held up after four dunks in the water. The spinning thread of pennies added a little challenge to precise and careful placement. There was some thread tangling too, but it was not bad.
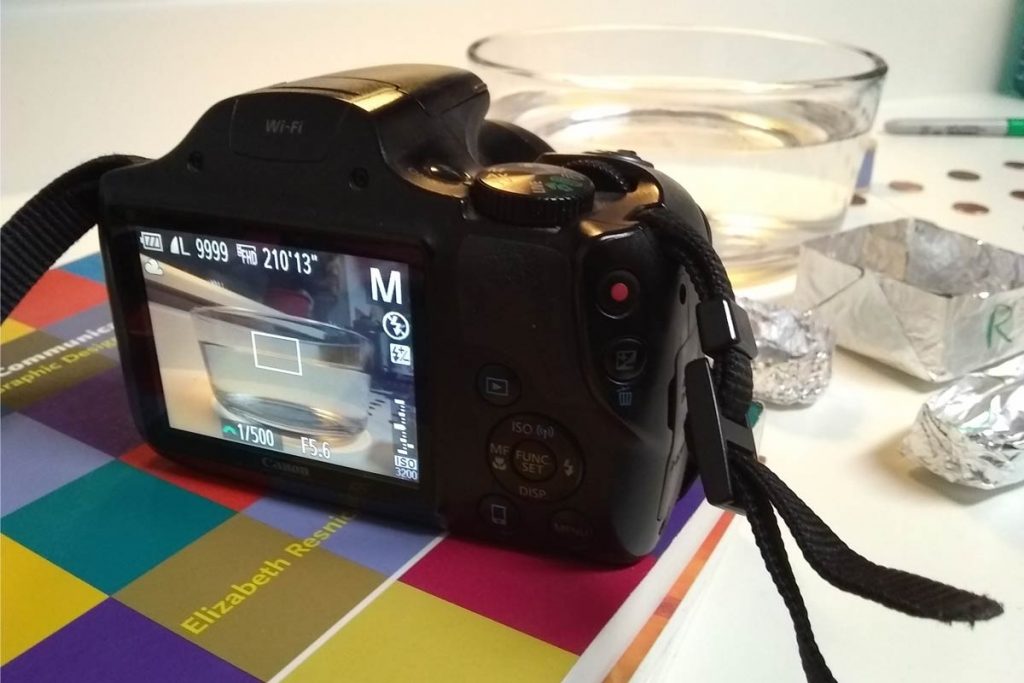
An SLR digital camera was used for another test. Three different camera angles were explored with the help of a stack of books to video the tests.
Why Video the Test?
Regardless of the type of failure (e.g., abrupt or gradual), it is helpful to video the test. In contrast to the building steps (which can be examined thoroughly via photos), failure can be better analyzed via a video of the test.
The Documentation to Test the Prototype
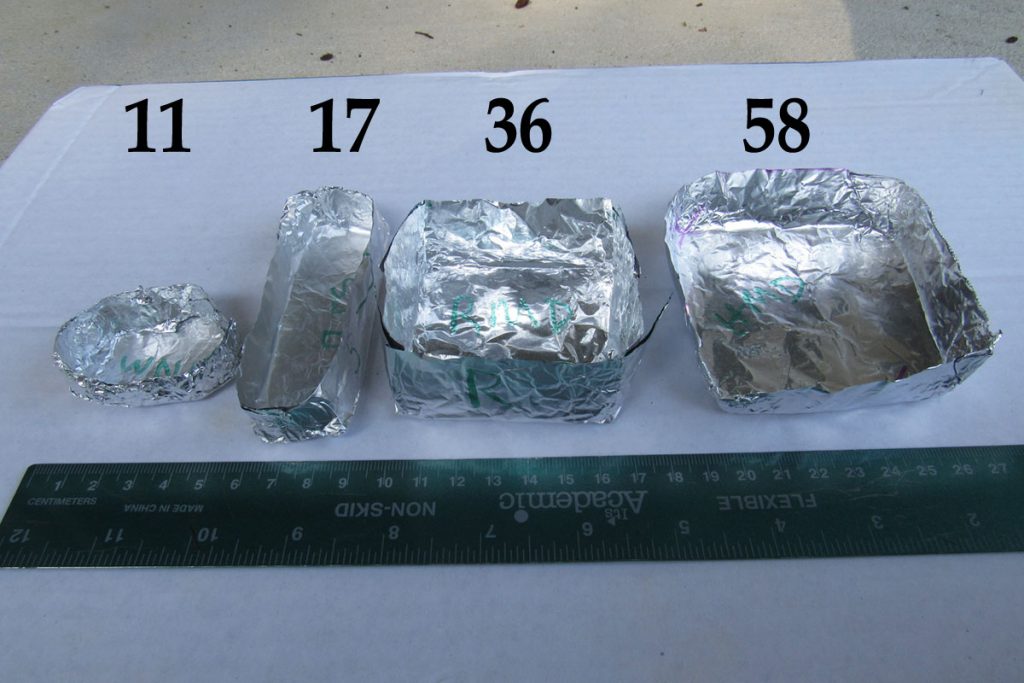
All watercraft are tested until failure. Failure when testing the paper water tanks was more nuanced than with the aluminum watercraft prototypes. So, what is failure in this case? The complete sinking of the aluminum watercraft equates to failure and ends the test.
To identify the craft and look for cause-and-effect relationships, a complete set of questions to evaluate the success of the solution could look like this:
- Name/owner of the watercraft?
- Number of pennies at failure?
- Was the entire five-inch square of foil used (it was supposed to be)?
- Were there leaks before failure? Y or N
- How many layers of foil were used to make the watercraft?
- Was the foil cut or torn? Y or N
- Which 2D shape best describes the watercraft’s base?
- What is the side-to-base relationship (e.g., perpendicular)?
- Maximum height of the craft?
- Minimum height of the craft?
- Area of the watercraft’s base?
These questions are in tune with the design specifications developed in substep B.2 – Specify Requirements.
Students record their tank’s characteristics and data on a digital or paper testing document and then pass that information to a Google Form to analyze all the class data in D.2 – Evaluate the Results.
If the students are writing the testing steps in part C – Create a Prototype, some non-negotiable testing steps are needed to get good data: E.g., Place pennies one by one gently in the watercraft. Also, place each penny strategically to balance the watercraft: The highest point of the floating craft should receive the next penny.
Engage the Observers in the Engineering Design Process
While you’re testing the watercraft of one student or group, what are the other students doing? They should be recording observational notes of the test. These notes can be shared with the testing student or group. Although these notes may be subjective compared to the penny-count-at-failure data, they should be used in the evaluation to offer an additional perspective. Plus, if you’re conducting the test in a face-to-face context, it keeps observers focused and helps with classroom management.
D.2 – Evaluate the Results
General questions to help students evaluate the results are:
- What problems did you overcome in designing and testing your prototype?
- What went well for your prototype?
- Which design features were common in the unsuccessful prototypes?
- Which design features were common in the successful prototypes?
- What would the pigs say about the results from your class?
- Which pig would benefit the most from a successful prototype? Why?
These questions address the success of the design and the satisfaction of the client pigs.
You can also have students go through every design specification and evaluate how much the prototype met (or did not meet) each one. However, this type of analysis could become tedious if there are many specifications. An alternative would be to reflect on the degree to which each design specification was addressed.
Looking at Data from the Engineering Design Process Example
In EDP, the achievement of the goal is not always easy to evaluate. Quantitative goals offer clarity and provide beginners a distinct view of a successful design. In this introductory example with the aluminum watercraft, students can sort, explore, and mine these test data to look for patterns and cause-and-effect possibilities.
Students in upper grades with more advanced math skills can explore statistical connections. Some areas are statistical variability, central tendency, data distributions, and bivariate data patterns.

Not Looking at Data
Going beyond the quantitative analyses and into opinion-based questions invites all students into the discussion. Revisiting the GRASPS with open-ended questions about how the pig clients would interpret the test results can stimulate deeper insights and strengthen the authenticity of the PBL as well.
Improve the GRASPS
At this point in the engineering design process, students have been working multiple weeks. After the testing—a high point in the lesson—student enthusiasm to see the evaluation through to the end may be waning. Try to reenergize students with the fact that their efforts will help future boatbuilders better solve the problem. A discussion about the hypotheses versus the test results can bring more life to the evaluation as well.
Prior test data should inform the GRASPS and be a research resource in substep A.2 – Investigate and Research the Problem. As such, students can leverage these results to reference the success of their prototypes. For each class, there may be an altruistic or empathetic interest in finishing the testing and evaluation strong so that others may benefit from their work.
Lastly, of course, there is competition. Many kids will want to compete for the greatest penny amount within their class, across sections, and against results from past years. Encourage it so long as students can be civil about it. You can also have students compete with regard to who guessed closest to their hypothesis for their prototype.
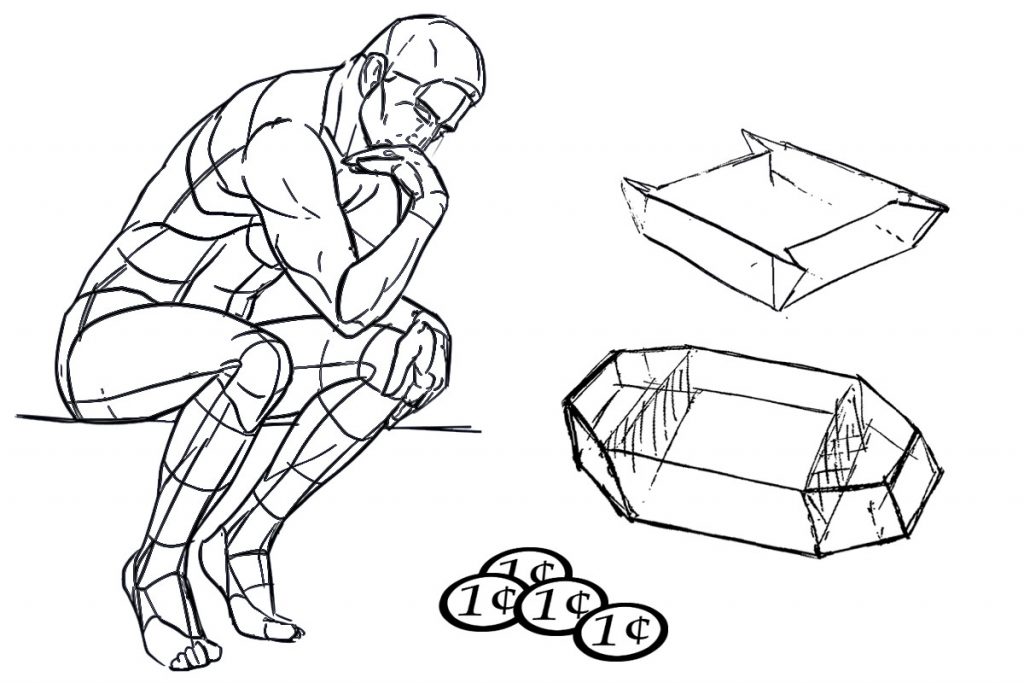
D.3 – Reflect to Improve the Design
Welcome to the final part of the engineering design process example! Beware that student responses can be shorter than expected here–they probably have worked many weeks. Assigning a few easy-to-answer questions can help draw out responses and keep the students focused. However, open-ended questions are essential to get to the heart of the impact of the design for the audience. Some examples:
- Short Answer: Based on the test data available, what would be a good goal for you (in the number of pennies) to create a successful watercraft for the pigs?
- Expanded Answer: How would you improve your prototype to support more pennies before failure? Try to include the design specifications to describe these improvements.
In general, students should identify which prototype characteristics should be modified to better achieve the goal. Using the design specifications for guidance will help. Students could also create an annotated 3D sketch of an improved design based on what they learned in D.2 – Evaluate the Results.
Summary of Step D – Test and Evaluate
In this final step, students test their prototypes and then evaluate the results against the design specifications defined in substep B.2 – Specify Requirements. They conclude the engineering design cycle with a reflection about how to improve their design. The evaluation data and reflections can serve as future research material for substep A.2 – Investigate and Research the Problem.
Now Repeat the Engineering Design Process?
Yes, but not right away. If you have gone deep into each of the EDP’s 12 substeps and spent many weeks exploring the problem, then take a break. Simple high-interest STEM challenges and/or quick design videos might be good choices at this point.
Even if you teach an abbreviated watercraft lesson as a 30-minute STEM activity, wait to repeat the process. Example: If you started your school year with this EDP lesson, then repeat it at the beginning of the following semester after the winter break. The repeated process should touch on each of the four EDP steps and could last about three or four classes.
Engineering Design Process Example Summary
Engineering design process lessons based on the problem-focused GRASPS model offer students authentic learning experiences. Novice and veteran teachers can easily teach STEM through EDP to their virtual and brick-and-mortar students using everyday materials to create a rich, PBL (project-based learning) adventure.
The aluminum watercraft prototype problem is a very low-budget engineering design process example and an easy way to introduce EDP. It can also be a commitment to a long-term stem project if you decide to go deep into the subsets of the engineering design process! Whether you’re looking for engineering design challenges for elementary or middle school students, there are many resources in this post to help your students leverage STEM for meaningful learning.
Science Olympiad events combined with familiar and engaging stories are two readily available resources to build rich content for EDP lessons. Once familiar with the engineering design process cycle, teachers can integrate resources available to them and connect standards to teach STEM through EDP and PBL.
EDP STEM Lesson Plans and Files (pdf files)
- GRASPS Scenario for the Aluminum Watercraft Problem (12 illustrated slides)
- Vocabulary Terms and Materials List for the Aluminum Watercraft Problem (4 pages)
- Poster of the Engineering Design Cycle, 4 General Steps (1 slide, 8.5″ x 11″)
- Poster of the Engineering Design Cycle, 12 Specific Substeps (1 slide, 8.5″ x 11″)
- Engineering Design Process (EDP) Steps Explained for the Aluminum Watercraft Problem (1 page)
That completes our example of the engineering design process! Students now have experience planning, building, testing, and improving a prototype. Low-budget style!
Whether you’re teaching STEM virtually or in person, these steps provide a complete and authentic learning journey through PBL and EDP.