Paper Airplane Introduction
This short lesson was created to provide grade 6 students with a brief introduction to the design cycle. The ideas here can be used for a paper airplane science fair project. The goal of the lesson was to create a paper airplane that would fly as straight and as far as possible. Basically, students investigated how to make a successful paper airplane. This design goal easily adapts to paper airplane design and testing in a classroom setting. Design, data, and discovery can happen with simple paper planes!
Paper airplanes were used since they are familiar to most students, the materials are readily available to teachers, and data are easy to generate and analyze. Project design ideas such as those using paper airplanes can be engaging, fun, and relevant for learning. MYP Design ideas can also come directly from science experiments.
The lesson came about at the beginning of the school year when students did not yet have access to their laptops. Individual digital projects were therefore out of the question and at this point in the school year, grade 6 students had not yet formally experienced a sequential design process.
September 2018 was the first time for the lesson–it did not have the benefit of a previous school year to improve upon, so keep that in mind if you try this out. For classes of about 20 sixth grade students, three sessions were needed (about one hour each) to complete the setting-the-stage/introduction, writing, sketching, data analysis, and reflection; however, there was some practice sketching done as well done as warm-ups at the beginning of each class.
If you want a longer lesson plan or MYP unit planner examples, look over Water Tank Engineering with Newspaper, Part 1, and Part 2.
GRASPS Scenario for Paper Planes
The purpose of the lesson was grounded in the relevant aspects of the GRASPS model by Wiggins and McTighe to provide a meaningful context for the student designers. A GRASPS context sets the design problem-solving stage for students within an authentic performance task. Specifically for our paper airplane lesson, the GRASPS looked like this:
- Goal – Design, build, and launch a paper plane to fly as far and as straight as possible.
- Role – Student engineer at [SCHOOL NAME].
- Audience – Your design teacher!
- Situation – Your teacher wants to know how you think about design:
- how you brainstorm ideas, and chose the best one; then gather test data, and use the data to improve your design.
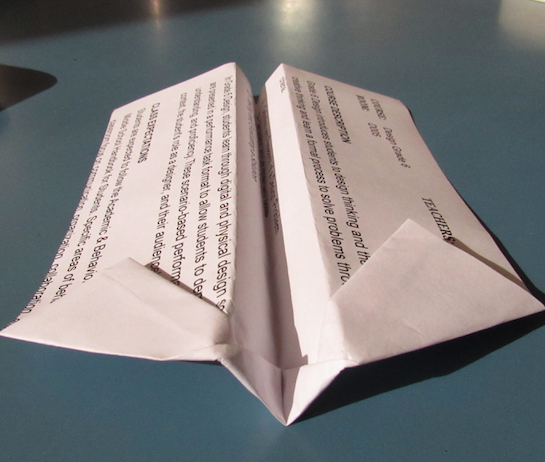
- Product – A paper airplane shall be made from 1⁄2 of a piece of letter paper (8.5 x 11 inches, cut along the width) that flies as far and as straight as possible.
- Standards (and Criteria for Success) – The paper airplane shall fly as far as possible and as straight as possible.
An example of how you might introduce the lesson is available via this Google slide presentation template (slides 1-7): https://goo.gl/i7yUWu
The images should be replaced as needed.
Since this was an introductory lesson, the role and audience were standardized to be the student and the teacher respectively. Not only does the GRASPS ground students into the context of the learning to make the project-based experience more relevant and meaningful, but teachers can also benefit as well. For example, when creating a design lesson—creating a learning experience around solving a problem for someone — teachers might benefit from writing the GRASPS first to frame their thinking and planning.
Variables and Flight Data
If the standards and criteria for success are to be honored, students need a valid and reliable way to accurately and fairly measure how far and how straight each airplane flies.
For more advanced students, consider a brainstorm of all of the variables that can be defined for paper airplane design and data gathering. This way, you can gauge prior knowledge. Then have the students decide which variables should be controlled. Finally, ask students which variables should be allowed to change so that the standards and criteria are best achieved for all designers.
If more guidance is needed for the paper airplane design and data lesson, present a list of all of the variables involved and their roles in the process. Here are some examples: launch force, distance from the launch point, distance from the intended flight path (error), paper size, paper mass, airplane shape, launcher surface friction, etc.
The time available to complete the lesson and the experience of the students with the data gathering process should factor into how the specifics of the variables should be presented. In the case of my sixth graders, they came with little science background knowledge and our time didn’t allow for a deeper exploration into the nature of variables and their role in the design process. Therefore, what was being controlled and what was being measured was simply communicated by the teacher (me).
Test Set Up for Airplane Launch
Consider reviewing the “How to Launch” slides (8-15) and query students about the set up with questions like:
– Why is the maximum lift height the same for every plane?
– How should the launcher be lifted for each test flight?
– Why should the back of all planes be even with the back of the launcher?
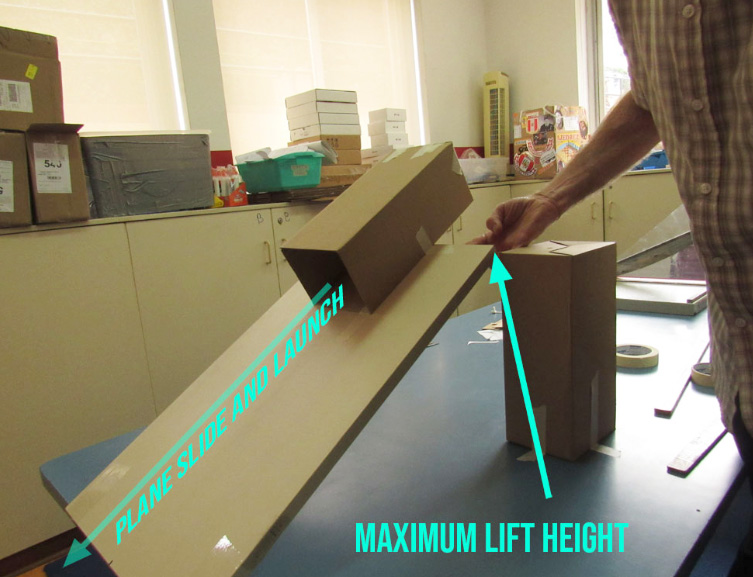
Test the launcher a few times to ensure that at the maximum height all the student planes will slide off. By being prepared, you can minimize unforeseen glitches. A hard, durable plastic laminate shelf worked well for this example. Plastic packing tape was used to make the hinge–where the shelf meets the table. The vertical box (“control tower”) in
slides 12 and 13 is about 30 cm high. The table is 74 cm high, and the launcher shelf is 60 cm long. The “control tower” provides an easy way to measure the maximum height to raise the launcher for each test flight. The rate of lifting the launcher should be the same for each test, and therefore one person should do this (probably the teacher) .
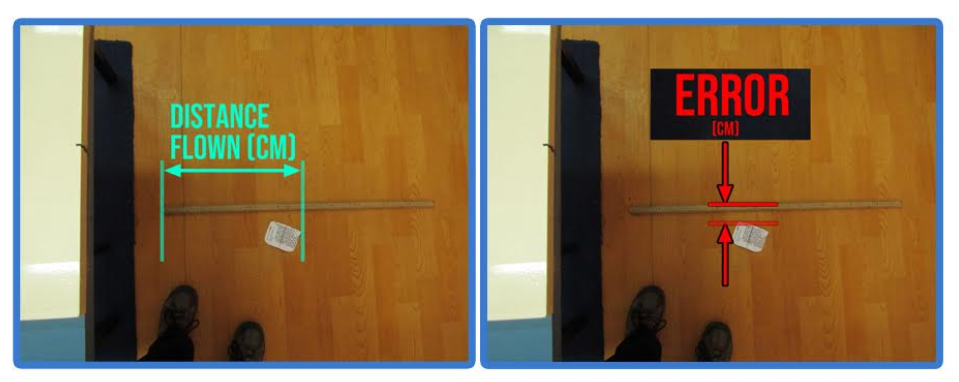
Pose this question to your students: How shall flight distance and straightness be measured? As a result, you will promote deeper thinking. For my sixth graders, we did consider using a rate as the metric to measure success. That is, we were thinking of using the maximum distance flown divided by the distance away from the flight path (error). In the end, the error was subtracted from the distance flown and determined to be 90 degrees from the flight path. Review slides 17-21 to learn how we measured distance flown and error.
Two plane shapes were emphasized–see slide 16. Students defined in their table groups the final plane as either triangular or square/rectangular. This request was to provide additional data for analysis, but at the end of the lesson, we did not disaggregate data by plane shape due to lack of time.
Paper Airplane Design Activity Sheet
This lesson’s brief introduction to design follows the four criteria of the MYP Design Cycle (note that Criterion B is slightly modified from the official version). This cycle is sometimes referred to as the IB Design Cycle. Students worked individually in Criteria A and B and partially in a table group in Criteria C and D to show their learning.

Image Credit: http://anwatindesign.weebly.com/
The activity sheet was developed while our design department was rethinking the titles of the four criteria to improve student understanding. Therefore, the labels in the student process sheet are slightly different than the labels in the MYP Design Cycle; however, the essence of each criterion/step remained the same. Each criterion was assessed formatively only since this was an introductory lesson.
Paper Airplane Flight Data
Six sections of design classes produced 42 pieces of paper airplane data. Table groups were made up of two to three students each. The averages of the distance flown, error from the flight path, and the distance flown minus the error, were calculated for each section of students.
After each group tested their plane, students entered the data into a Google Sheet which was projected onto the classroom whiteboard from the teacher computer. We did gather hypotheses as well before each test to promote greater engagement into the learning.
Engineering Design Standards and More
An engineering-focused design lesson like this one naturally offers students opportunities to explore and, in time, master many of the NGSS Science and Engineering Practices (e.g., 1 to 6) and the NGSS Cross-Cutting Concepts (e.g., 2, 4 and 6).
What might not be obvious are the connections to other standards. The lesson does strengthen certain English Language Arts Standards (Science & Technical Subjects – Grade 6-8), such as:
- CCSS.ELA-LITERACY.RST.6-8.3
Follow precisely a multistep procedure when carrying out experiments, taking measurements, or performing technical tasks.
The ISTE Standards for Students have evolved as well to include an emphasis on design. At the time of this blog post, the 2016 version was the most recent and included a standard dedicated to designing with and without digital tools:
- Innovative Designer
Students use a variety of technologies within a design process to identify and solve problems by creating new, useful or imaginative solutions.
Paper Airplane Design and Data – Reflection and Next Steps

Paper airplanes are familiar. In this example, with distance and error, the activity offered students different ways to collect data. The fact that the materials were very accessible also allowed for easy ways to collect data in the classroom and methods to collect data for research as well.
Quick and easy STEM activities for middle school can include paper airplane design and data gathering! However, if I were to revisit this activity, I would dig deeper into the data. I might ask the grade 6 students to sort the flight data in Google Sheets on their laptops and to calculate averages as well. The students would examine the best-designed planes in terms of the design goal, quantitatively define a successful solution based on the data based on the 42 test flights, and go through the design process once more to improve and reflect on their design.